Rural, majority-Indigenous Bolivian municipalities have experienced deadly political violence at nearly four times the rate of urban, minority-Indigenous municipalities. Cities with an indigenous majority experience experience such violence at 2.7 times the rate of their minority-Indigenous counterparts. These disparities were strongest during the neoliberal governments of 1985–2003, but persisted under the left governments of the Movement Towards Socialism (2005–19, 2020–25). Violence during the interim governments of 2019–2020 was largely in Indigenous-plurality cities and rural areas, as well.
The overall patterns is far too dramatic to have occurred by chance even if the clustering of around 700 deaths into around 250 localized events is simulated, making the overall disparity statically significant. The analysis here covers the period from the October 1982 return of democracy to the end of the Luis Arce administration in November 2025.
Mapping deaths in Bolivia’s racial geography
As long as I’ve been tracking protest-related deaths in Bolivia through the Ultimate Consequences digital archive, I’ve been interested in how the burden violence falls unevenly in the country, especially in on the country’s large Indigenous population. However, Bolivia’s peculiar way of handling race means that individual identities as Indigenous may be fluid and are rarely recorded journalistic coverage. Recently, I’ve been working, with the help of student research assistants, on various ways of tackling the uneven burden of political violence in Bolivia. In this work, we use the municipality where violence occurred as a tool for understanding who was most directly affected. The clearest result is this new way of visualizing the uneven pattern of violence: situating each municipality in two dimensions: how urban or rural the municipality is, and how many Indigenous people are a part of it.
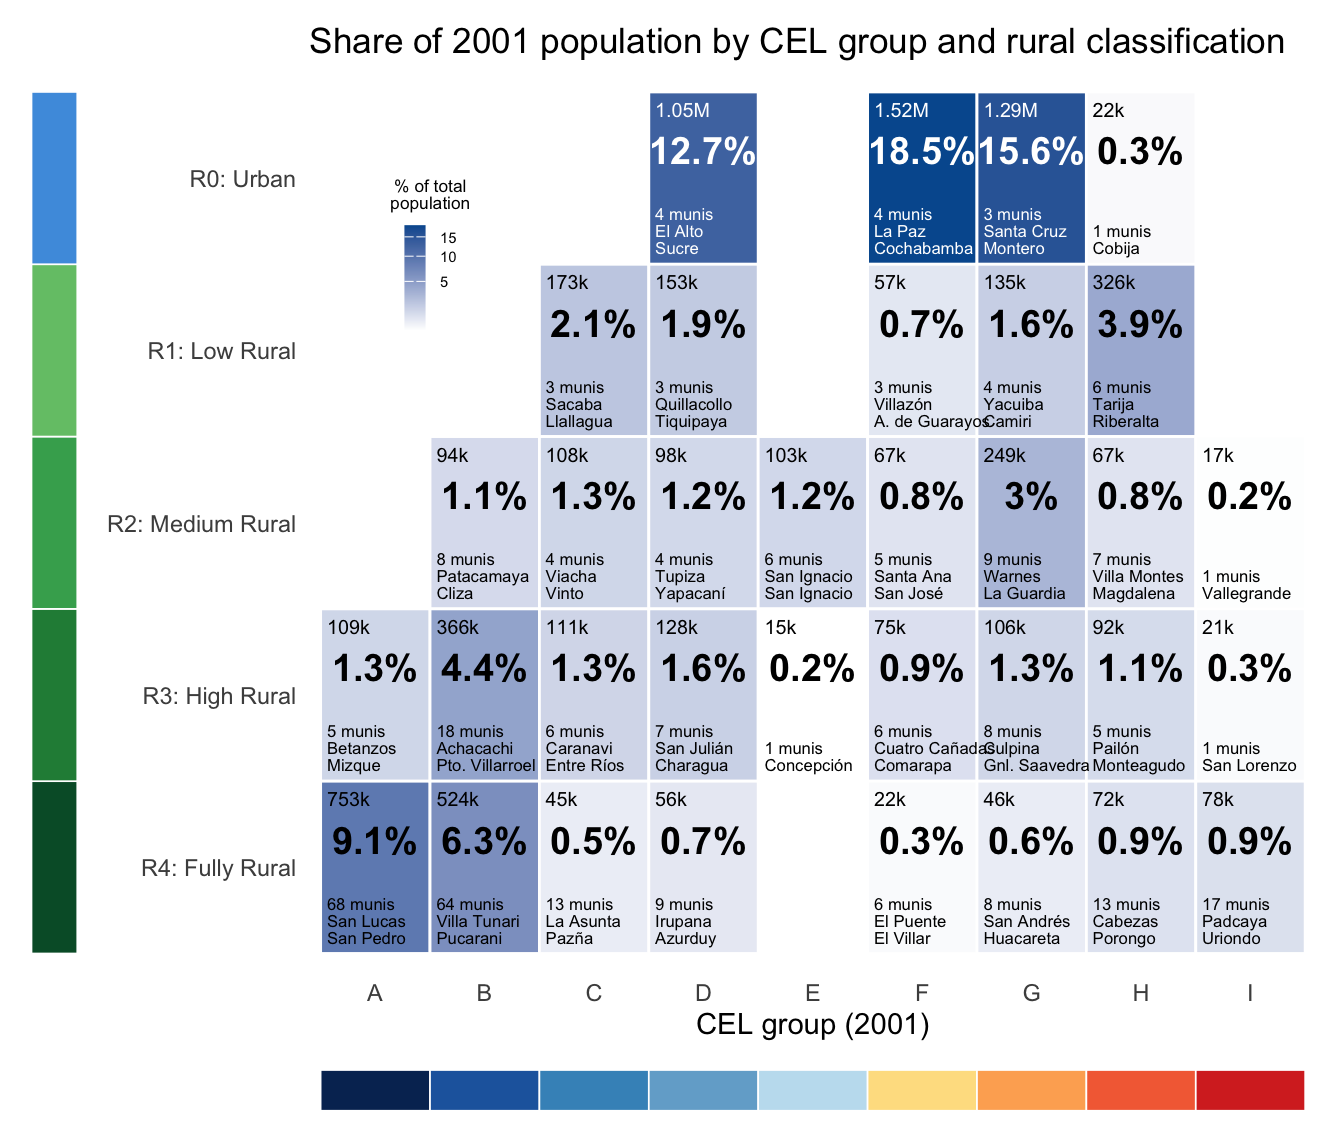
We’ve mapped out these dimensions using Census data. For indigeneity, we were following in the footsteps of prominent anthropologist of Xavier Albó and researcher (and later administrator{ Carlos Romero. With calls for Indigenous political autonomy rising in the early 2000s, Albó and Romero argued that existing municipalities might be easiest venue for many Indigenous communities to exercise autonomy, and they devised a quantitative scale for measuring Indigenous presence given the different ways Bolivians state their identity. Their nine level scale, lettered A to I goes from overwhelmingly Indigenous communities where at least 90% of people both call themselves Indigenous and speak a Native language (A) to a two-thirds majority identifying and a majority speaking (D) down to at least 10% defining themselves as belonging to an Indigenous people (H).
For urban-versus-rural, we used the Census division of all land into urban and rural areas, and calculated population share for each municipality. We called the 12 municipalities with 10% or less rural population “urban” (R0), designated the over 200 almost entirely (>90%) rural municipalities level R4 and named three levels in between. (While Bolivia is becoming more urban and less Indigenous over time, at least in terms of citizens’ answers to census question, we stuck with the 2001 Census values since the deaths from political violence clustered tightly around that year with half of all deaths occurring between 1996 and 2006.)
You can see how Bolivia’s population is spread out among these categories, with a much wider range in Indigenous presence among rural areas than urban ones. The most populous positions are the moderately Indigenous cities (four municipalities including La Paz and Cochabamba), the less indigenous lowland cities like Santa Cruz, the more indigenous cities (El Alto and Sucre), and then the vast number or highly indigenous and fully rural municipalities (68 and 64 of which together contain nearly sixth of all Bolivians).
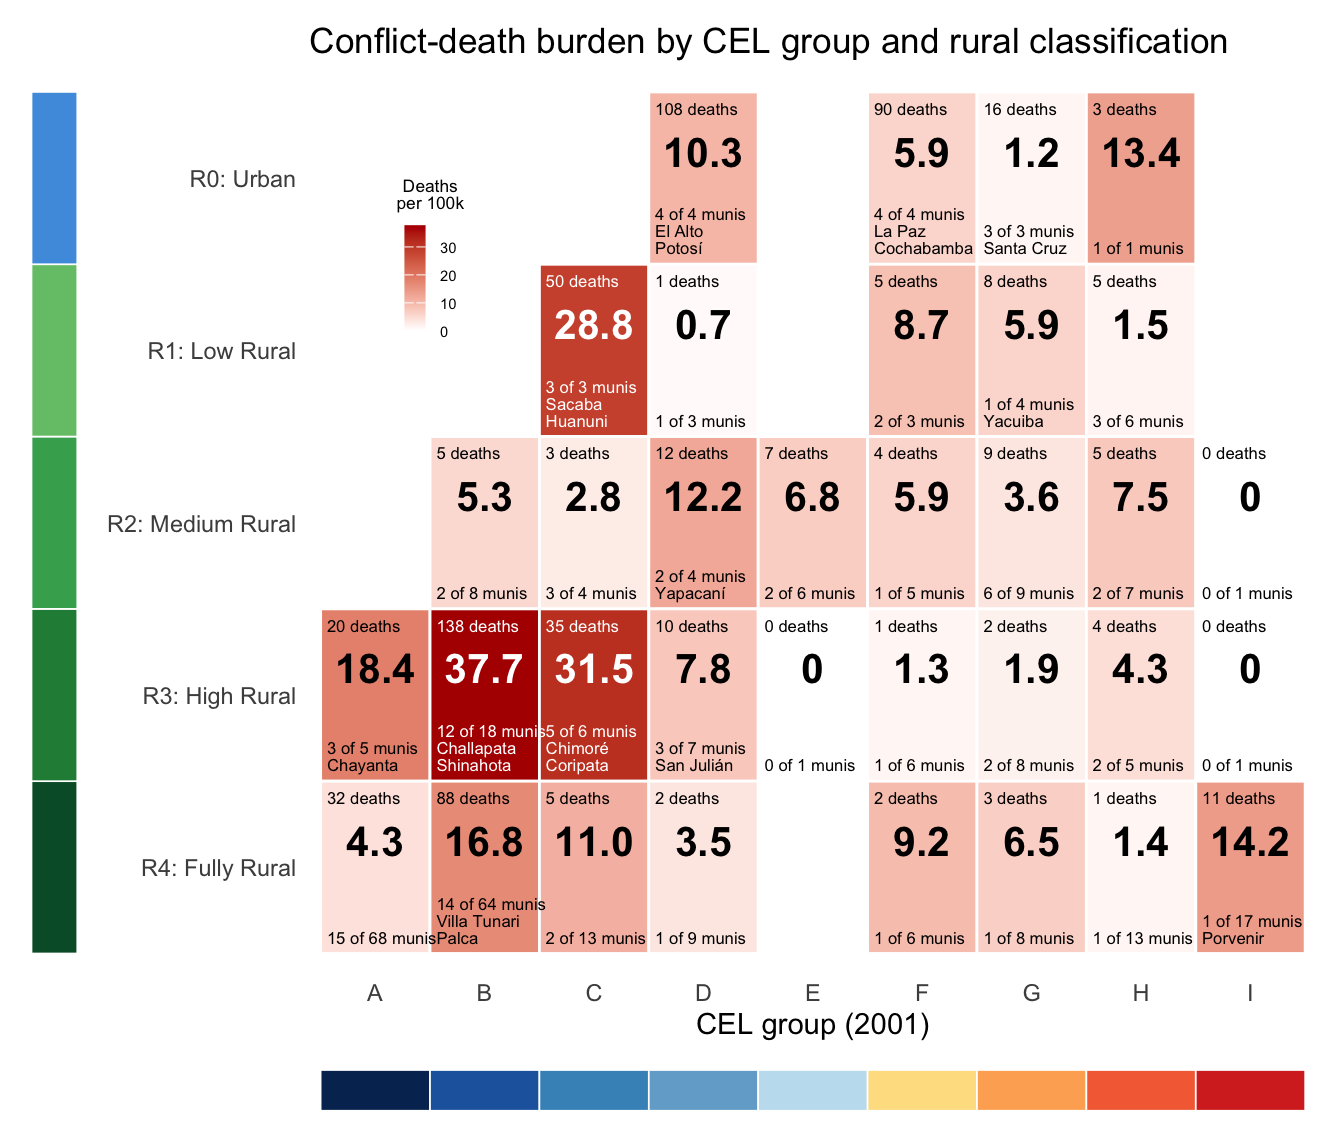
Picturing social-movement-related deaths on the same grid shows us a different pattern (click to the right see it). In the second grid, red shading represent the number of deaths per hundred thousand residents, which reaches its maximum in highly but not fully rural municipalities like Challapata and Coripata, Shinahota and Chimoré, epicenters of inter-ayllu violence and the coca war, respectively. 17 of the 24 municipalities in these two blocks experienced deaths. Peri-urban Sacaba and mining town Huanuni were part of the smaller C/R1 block that experienced deaths at nearly the same rate.
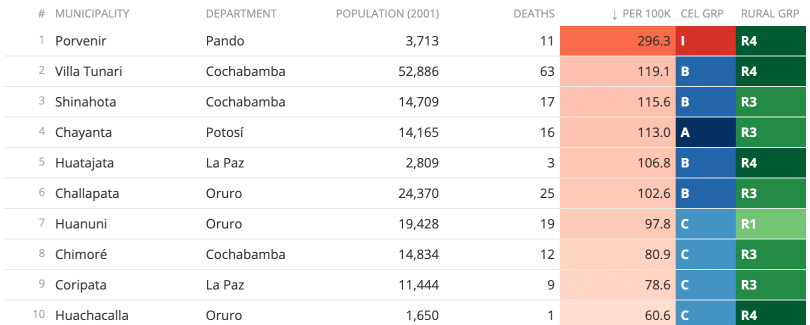
All of the twenty-five municipalities that suffered the greatest death burden (shown here as deaths per 100,000 residents) across the entire dataset, and all but three were in the Indigenous-majority categories (A–D). If we look instead the the twenty-five municipalities that suffered the greatest number of deaths (seven or more over four decades), six urban municipalities join the list, led by El Alto (D) and La Paz (F). Still, 20 of those 25 have an Indigenous-majority. The single greatest death burden was in Porvenir (Beni department, I/R4), a low-population municipality that was the scene of the 2008 massacre of 11 non-resident Indigenous protesters marching to Cobija.
A pattern far too skewed to have occurred by chance
So, both living in an Indigenous-majority population and living in rural area seem to increase one’s likelihood of dying in political conflict in Bolivia, but how sure are we that this pattern is significant rather than a random effect. After all, only one in 12,000 Bolivians died in these events.
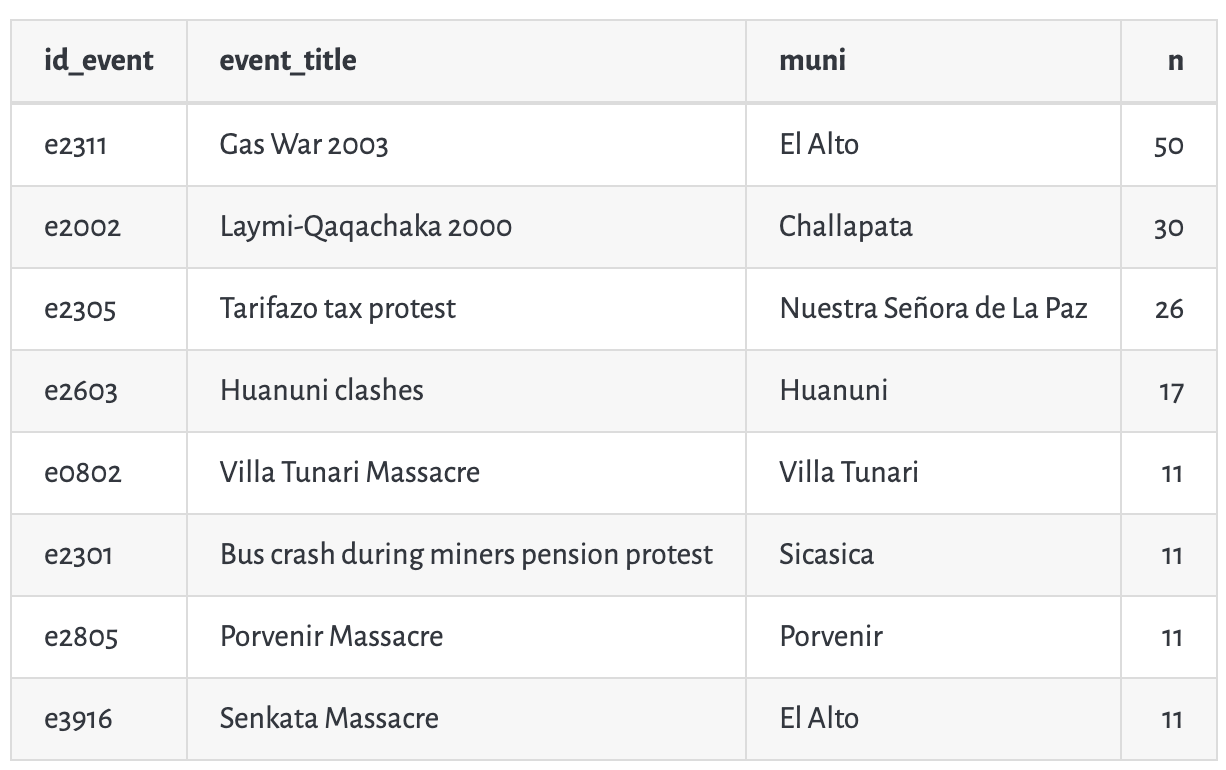
To test this, we simulated what would happen if every Bolivian citizen were equally likely to be killed. And we set up a second simulation where deaths were just as clustered as they were in the actual dataset (the largest such clusters are in the table to right), but the locations were still random. We also divided Bolivia’s municipalities into quadrants, grouping CEL groups A–E and F–I together and separating urban from rural municipalities, each being a 48%/52% split.
The result: under the more realistic of the two simulations, the chance of the observed urban/rural difference happening by chance was p=0.0016 and the chance of the Indigenous-majority/minority difference was p=0.0001.
Our analysis is summarized in this graphic in both English and Spanish.

